Local adult reoffending
Last week the MoJ published the latest local adult re-offending rates.
These figures will be scrutinised more closely than ever given the upcoming privatisation of the probation service via the government’s Transforming Rehabilitation project.
Proponents and critics of TR will seek to find ammunition for their cause.
And those seeking to win the new reoffending contracts will be delving into the small print.
I’ve done some very basic analysis to try to identify key trends.
However, the data should come with a health warning – these figures are published quarterly and tend to fluctuate considerably – as will be the case if the MoJ persists with its plans to measure reoffending via quarterly cohorts under its TR plans.
Details of the data
The MoJ stats contain reoffending data at the following geographic levels:
- Regions within England and Wales
- Probation Trusts
- Local Authorities
They cover re-offending of all adult offenders on the probation caseload in England and Wales in the period 1 April 2012 to 31 March 2013.
There were 616,252 offenders on the probation caseload (who could be matched on the Police National Computer – that is their reconviction could be measured) – a reduction of 29, 132 on the previous year (a drop of 4.5%).
Are re-offending rates going up or down?
Down is the straightforward answer.
The fairest way of presenting these statistics is to compare actual reoffending rate against the predicted reoffending rate.
The predicted rate takes into consideration the profile of offenders in the current cohort. Over recent years, the probation caseload has been increasingly made up of offenders with a high risk of reoffending. This is one of the reasons that comparing historical reoffending rates can be misleading.
Therefore measuring actual reoffending against predicted reoffending provides a fair measure of performance.
On this measure, the reoffending rate of those supervised by the probation service nationally was 9.18% against a predicted 9.67% – a reduction of 5.05% – more than enough to secure a payment by results bonus under the proposed Transforming Rehabilitation contracts.
What’s the difference between Probation Trusts?
What, to me, was much more interesting was to examine the difference in reoffending rates between probation trusts.
Seven Probation Trusts had a statistically significant increase in re-offending, whilst 14 Probation Trusts showed a statistically significant reduction in re-offending.
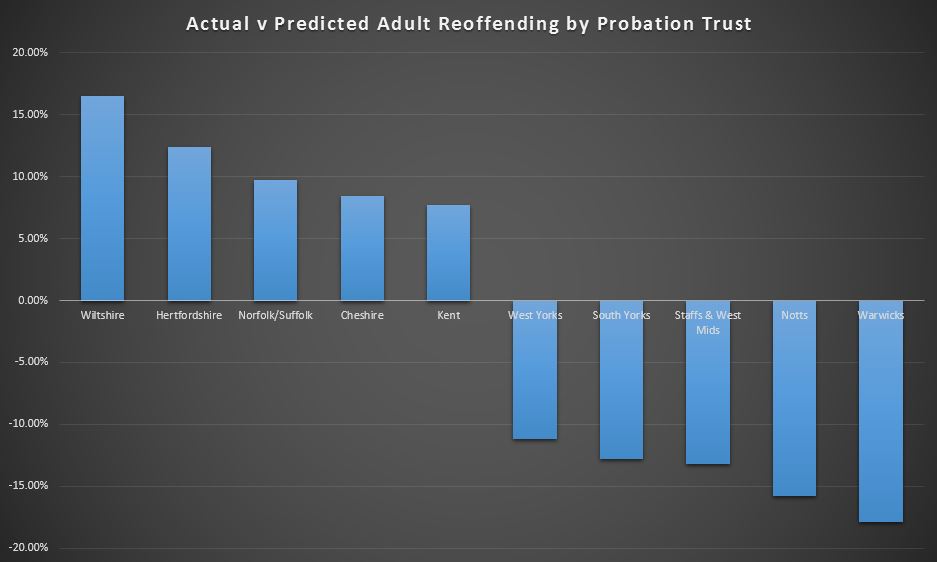
Again, the fairest thing to do was to compare the predicted rate of re-offending with the actual one.
The five best performing probation trusts were Warwickshire, Nottinghamshire, Staffordshire and West Midlands, South Yorkshire and West Yorkshire.
The five worst performing probation trusts were Wiltshire, Hertfordshire, Norfolk/Suffolk, Cheshire and Kent.
Details in the chart below.
When the MoJ publish their updated version of the Straw Man payment mechanism for the new Transforming Rehabilitation contracts (delayed until mid-September, it was announced this week), we will have a better idea of how the reducing reoffending baseline will be calculated.


6 responses
It’s great you’re highlighting these excellent results Russell but comparing on the % change for the 5 best and 5 worst is misleading as that is hugely influenced by the cohort size. London reduced reoffending by over 10% below predicted – a massive figure when you’re looking at 94,000 offenders. That is just as significant as Warwicks with 4,000 offenders yet London doesn’t feature in your best 5. All you can really say is 14 Trusts are now statistically significantly reducing reoffending – twice the number from last year and the national improvement is accelerating. If the baseline period for PBR is set prior to this improvement q then hitting the targets for these 14 areas could be like shooting fish in a barrel!
Thanks Dave, you are right about statistical significance and cohort size and that how the baseline is defined will be critical.
Under PBR with what will the reoffending rate in one CRC be compared with, to judge if it is making an impact? If the ‘background’ trend is down, and there is reason to suppose that is likely, how will MoJ screen out that general trend? The only way I think of is to set up a matched control group but I am not sure that is possible when all similar offenders are in competing CRCs. Does anyone know?
It will be a historical comparison with reoffending rates in the same area.
Well, if the comparison is simply change over time, then you won’t know whether a fall is due to a) the work of the CRC or b) a general background change in propensity to offend – such has clearly been underway in the UK and many other developed countries for two decades now.