
Gun deaths in Europe
One thing the UK can be proud of is the very low level of gun deaths.
One thing the UK can be proud of is the very low level of gun deaths.

A new Clinks guide for the voluntary sector on the workings of the criminal justice system.

Official figures for 2020 show prosecutions down 26% but out of court disposals up by 18% on 2019.

The latest statistics on women in the criminal justice system

Official data for 2019 shows fewer defendants, more Crown Courts remands in custody and fewer people sent to prison, but for longer.

A graphic look at the decline of the community sentence over the last decade.

An interactive infographic showing the age and capacity of all the prisons in England and Wales.
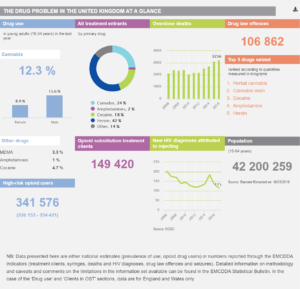
Latest EMCDDA report found that public expenditure on drug-related issues is 0.5% of our GDP.

A series of striking infographics show the latest drug trends in Europe and the surprising level of difference between countries.

The total number of individuals formally dealt with by the CJS has been declining since 2015 and fell 3% in the latest year to a record low (since 1970).

The shocking scale of the failure of the Transforming Rehabilitation probation reforms revealed in numbers.

In 7 London boroughs violent crime has gone up more than 8% over the last year.