
Crime outcomes
The Home Office recently (26 February 2015) published revised statistics about Crime Outcomes in England and Wales. Crime outcomes is the new jargon for detection rates. There were six outcomes in the detections framework prior to April 2013, nine from April 2013 to March 2014 and from April 2014 there are a total of 19. This expansion in the number of outcomes follows a public consultation which aimed to make the recording of crime outcomes more transparent and reliable.
This report gives information about crime outcomes in England and Wales for the financial year 2013/14. As someone not particularly familiar with detection rates, I found them intriguing reading.
[divider]
Detection rates vary according to crime type
For me, by far the most interesting part of this report is the table shown below which shows what proportion of crime was solved according to different groups of offences and what the criminal justice outcomes of these solved crimes were:

As you can see, detection rates vary enormously according to the type of crime.
Only about one fifth of theft (18.3%) and robbery (20.8%) offences are solved and the offender dealt with. See my post on a new Policy Exchange paper which argues that shoplifting has been de facto decriminalised.
Just over one quarter (27.4%) of sexual offences and just over two fifths of offences of violence (41.7%) are solved. I also found it interesting that in almost a quarter of those violent offences where the offender was arrested, s/he was dealt with by way of a caution.
[The fact that over 90% of drug offences were “solved” is a red herring since most drug offences relate to possession which only comes to light when a person is found in possession of drugs whereas for other groups of offences, a crime is typically reported to the police and then has to be solved and the perpetrator apprehended.]
[divider]
Fraud
A further interesting area covered by this report is the first presentation of outcomes relating to offences of fraud. The Home Office is keen to emphasise that these statistics are experimental but they are of particular interest as many commentators think that one of the reasons that the crime rate has reduced so markedly over recent years is that an increasing amount of offences of fraud are committed online and never reported. You can see from the table below that almost 19/20 offences of fraud are not solved:
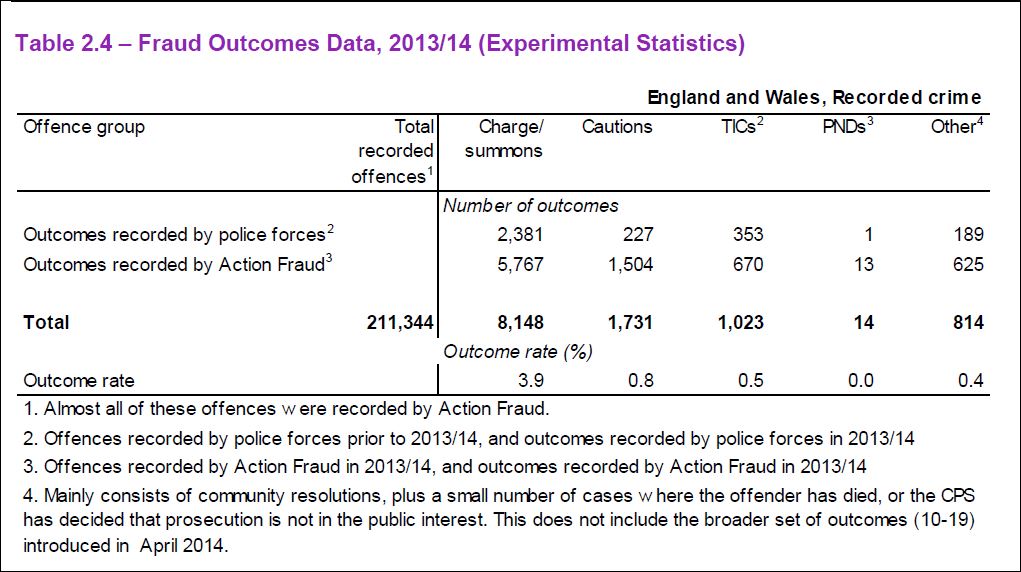
Note: from April 2011, Action Fraud gradually took over responsibility for recording fraud offences, although it was not until the end of March 2013 that all police forces had passed over the recording of fraud.
[divider]
Conclusion
This report was originally published in July 2014 and updated in February 2015. By the time that the figures for 2014/15 are published, the new outcome definitions should have bedded in and be used routinely by all police forces. It will be interesting to see whether the significant cuts in police forces have an impact on detection rates.