
Yesterday, Public Health England published the adult substance misuse treatment statistics for 2018/19. Here are the main findings.
Overall numbers in treatment
The number of adults in drug and alcohol treatment last year was almost identical to the year before (268,251 compare with 268,390 in 2017/18). However, the number of adults entering treatment increased by 4%, representing the first increase in the number of people coming into treatment in the last six years.
Following on from the last 2 years, there has been a continued rise in the number of adults starting treatment in the year with crack cocaine problems. This includes people who are using crack without opiates (4,535 compared to 4,301) and with opiates (24,363 to 22,411). While this increase is not as steep as previous years, the number of people starting treatment with crack problems has increased 32% since 2013 to 2014.
Substance trends
People starting treatment in the year saying they had problems with powder cocaine also increased in 2018 to 2019 (17,796 to 20,084). These increases in people coming to treatment with crack and cocaine problems are likely to be related to a surge in global cocaine production. This surge has lowered prices and increased purity. We have also seen changes in distribution and supply, such as ‘county lines’ drug dealing operations.
There was an increase in the number of adults entering treatment in 2018 to 2019 for problems with new psychoactive substances (NPS) (1,223 to 1,363, or 11%). This increase was largely driven by those taking NPS alongside opiates (they increased from 584 to 751, or 21%).
Complex needs
One-fifth (19%, or 24,565) of adults entering treatment last year said that they had a housing problem. This number varied by substance group, ranging from 1 in 10 (10%, or 5,208) starting treatment for problems with alcohol alone and almost a third (32%, or 13,405) starting treatment for problems with opiate use. The people starting treatment for problems with NPS had the highest proportion of housing need of any substance group (44%).
Over half (53%) of adults starting treatment said they had a mental health treatment need, ranging from 49% for people with opiate problems to 59% for people with non-opiate and alcohol problems.
Treatment exits and deaths
There were 118,995 people that exited the drug and alcohol treatment system in 2018 to 2019. Just under half (48%) left having successfully completed their treatment, free from dependence. This was the same level as the previous year.
The total number of people who died while in contact with treatment services in 2018 to 2019 was 2,889 (1.1% of all adults in treatment). This is an increase from the previous year (2,660, or 1% of all adults in treatment).
We saw increases in deaths for people in treatment across all substance groups, but the overall increase was driven by those in treatment for problems with opiates (1,712 to 1,897, or 1.4% of adults in treatment for opiate use).
Drug use is a significant cause of premature death in England, as the Office for National Statistics data has shown. In England, the number of deaths from drug misuse registered in 2018 increased by 16% to 2,670. This is at the highest level ever, with deaths of middle-aged heroin users being one of the main causes of the increase in drug poisonings. There was also a large increase in deaths involving powder cocaine or crack.
Who is in treatment?
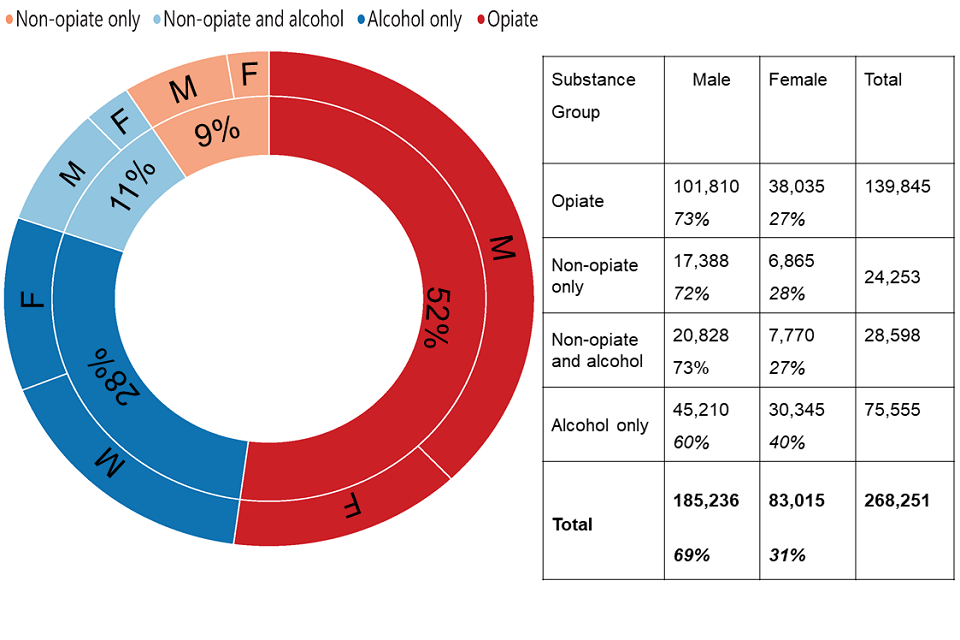
The graphic below shows the substance use and gender of people in treatment for the four main groups used by the National Drug Treatment Monitoring System (NDTMS): opiate users, non-opiate users only, non-opiate and alcohol users, alcohol only users.
There are more older people in treatment
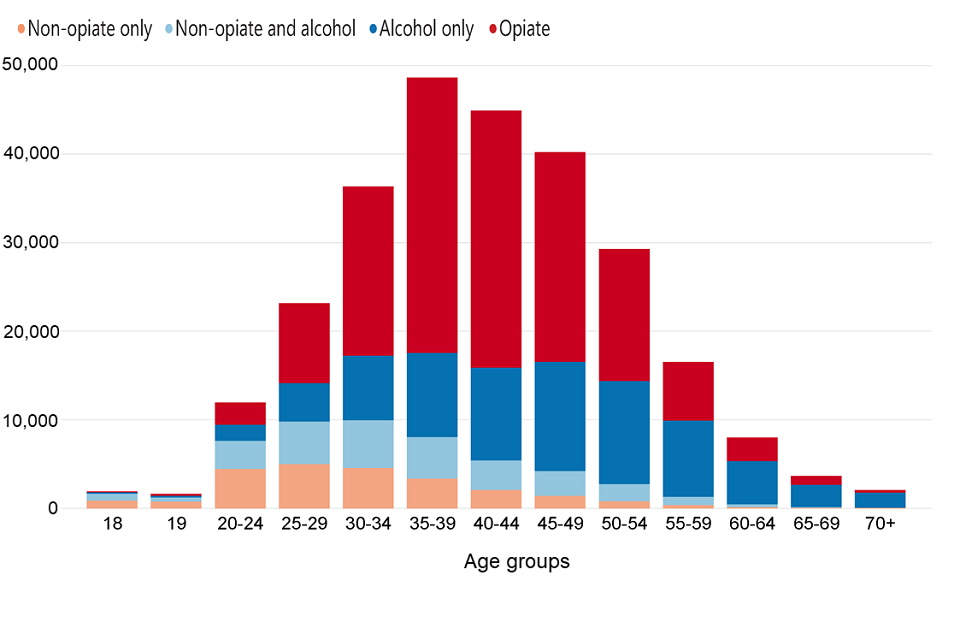
The age of people in treatment has continued the trend from previous years showing an increase in older age groups. More than half of the people in treatment were over 40 years old (54%), with less than 10% of people in treatment for opiates or alcohol only were under 30 (8% for opiates and 9% for alcohol only).
The median age of people in treatment for the substance groups was very different with the median age of the alcohol only group being 16 years older (46) than for non-opiates only (30). People in treatment for opiates had a median age of 41.
The distribution of ages of people in treatment (see below) mirrors patterns seen in estimates of prevalence of drug and alcohol use. The latest estimates for 2016 to 2017 show a significant increase in those aged 35 and over who use opiates (130,628 in 2010 to 2011 and 175,452 in 2016 to 2017), reflecting an ageing group rather than new, older users of the drug.
A large proportion of opiate-users in treatment will have started using heroin in the epidemics of the 1980s and 1990s and are now over 40 years of age. In 2017 to 2018, 69% said they first used heroin before 2001 and only 9% first used heroin since 2011.
People who use other substances other than opiates or alcohol tended to be younger.
Treatment settings
Almost all (99%) people in treatment received some form of structured treatment. Of the people that did receive a structured treatment:
- 97% received a community-based treatment
- 9% received treatment in a primary care setting
- 4% received treatment in an inpatient setting
The number of people receiving treatment in inpatient and residential settings has continued to fall. There were 25,847 people receiving treatment in those settings in 2014 to 2015 compared to 16,757 people in 2018 to 2019, a drop of more than one third (35.2%) in just four years.
A long-term view
One particularly interesting piece of data related to the almost one million (966,040 different people) individuals who have been in contact with treatment services in the last 14 years for which treatment data in this form have been available.
By 31 March 2019:
- 141,667 (15%) were still engaged in treatment
- 383,954 (40%) had left and not completed their treatment and not returned
- 440,419 (45%) had completed their treatment and not returned.