On 27 July, the Government announced the early termination of the CRCs’ contracts. Various bodies have criticised the new probation arrangements and some private companies have made substantial losses because the number of sentences they were asked to manage was lower than anticipated. We expect, therefore, the CRC’s reoffending rates to be poor given this context. My previous blogs after 3 and 6 months of results found the binary rate of reoffending to be down, but the frequency of reoffending to be up (both compared to 2011). This blog reviews what happened after 12 months of payment of by results.
Reoffending rate and frequency
Between Oct 2015 and September 2016, the CRCs collectively supported approximately 108,000 offenders who qualified for payment by results and 45.4% of these reoffended. Of those that reoffended, on average they committed 4.7 offences each. These results compare to an expected reoffending rate of 47.5% (the 2011 baseline rate) and an expected average number of offences of 4.2 (the average recorded 2011). In other words (and as previously concluded), there are fewer offenders but they are committing more offences. Only a handful of CRCs have performed differently to this overall picture. Figure 1 below describes the reoffending rate recorded in each CRC. The grey circle indicates that CRC’s 2011 baseline reoffending rate.
Figure 1: Adjusted reoffending rate in each CRC (commencements Oct 2015 to Sept 2016)
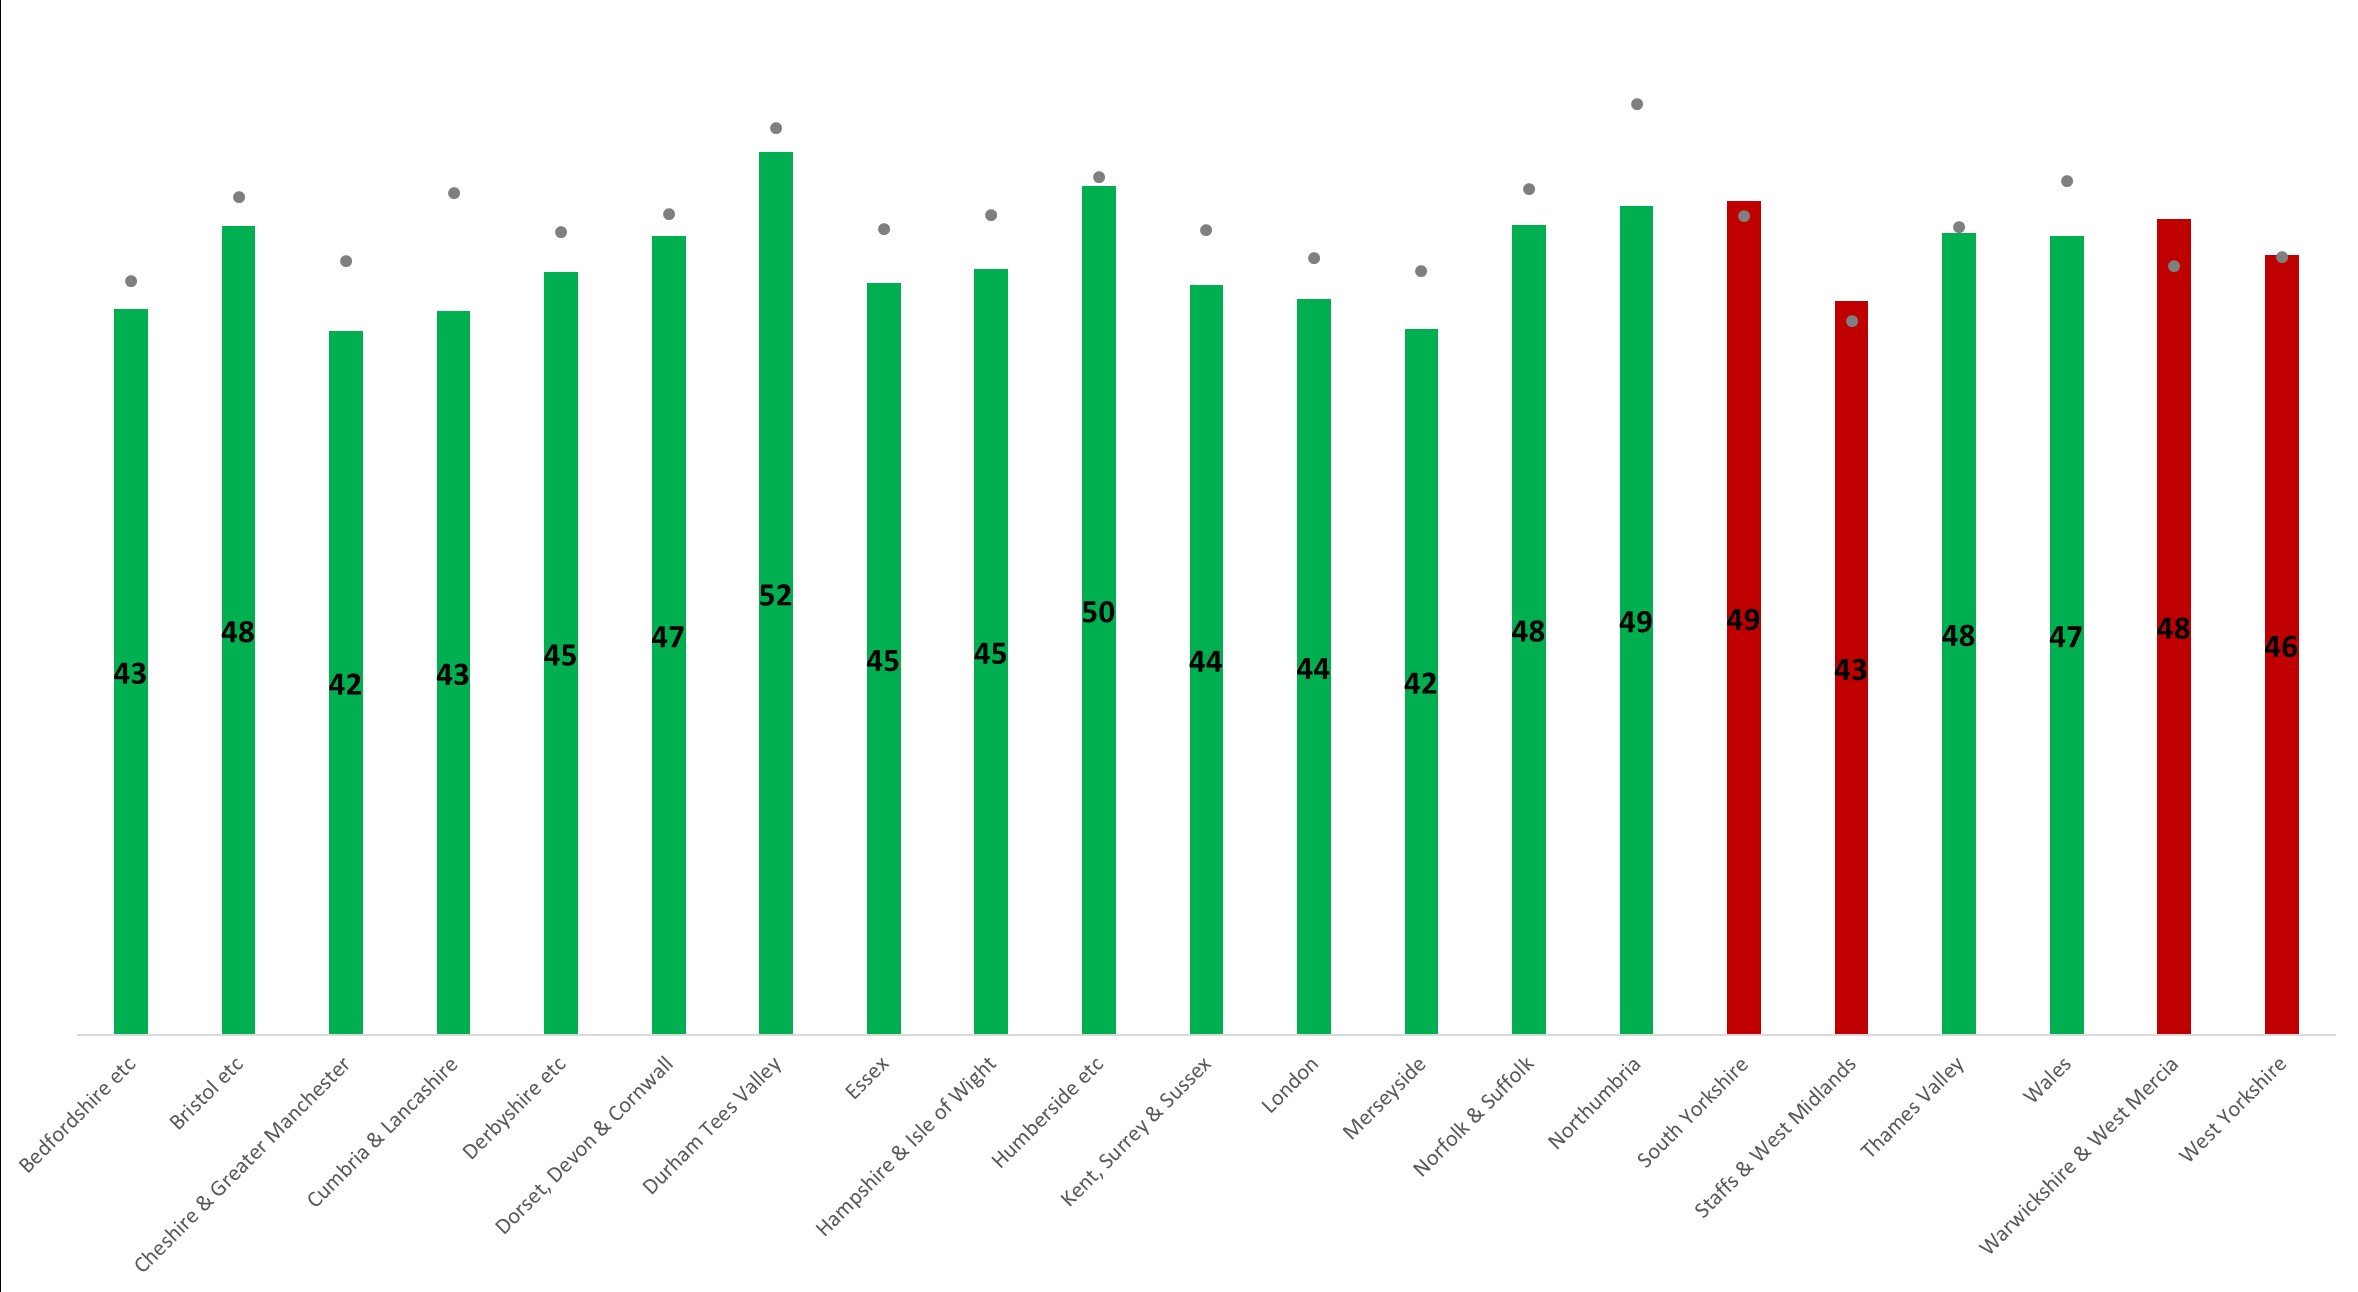
Seventeen of 21 CRCs recorded a reoffending rate lower than the 2011 baseline. Some of the reductions were large – such as the 7% reduction in reoffending recorded in Cumbria and Lancashire. Four CRCs recorded reoffending rates higher than the 2011 baseline (indicated in red in Figure 1). The worst performing CRC was Warwickshire and West Mercia where the reoffending rate was 3% higher than the 2011 baseline. Figure 2 below describe the average number of reoffences in each CRC (the grey circle indicates the baseline average).
Figure 2: Average number of reoffences in each CRC (commencements Oct 2015 to Sept 2016)

The general pattern in Figure 2 is the opposite of that shown in Figure 1: Nineteen CRCs recorded an average number of re-offences worse than the 2011 baseline (Durham Tees Valley and South Yorkshire substantially so). Just two CRCs beat the baseline average: Merseyside and Northumbria (the same two CRCs were the only ones to beat the baseline after 6 months).
Actual and expected re-offences
Contrasting results were recorded for the two reoffending indicators used for payment by results – the reoffending rate and average number of reoffences. Only two CRCs (Merseyside & Northumbria) recorded results better than 2011 for both indicators. How can we therefore assess the overall performance of the CRCs? A good method is to compare the actual total number of reoffences to the expected total number of reoffences. Across all the CRCs, the actual number of reoffences was 221,220 compared to an expected number of 214,618 (if performance was the same as 2011) – a difference of 6,602 and an increase of 3%. This suggests that overall reoffending performance was slightly worse under Transforming Rehabilitation. Figure 3, however, describes the percentage reduction and increase in the number of offences at each CRC and there was a large range in performance.

Nine CRCs recorded fewer re-offences than were expected. Merseyside was the best performer with a 29% reduction in offences. Northumbria (19%), Cheshire & Greater Manchester (12%) and Cumbria & Lancashire (10%) also recorded large reductions. The remaining 12 CRCs recorded more offences than expected. The increase was as high as 41% in South Yorkshire and 28% in Durham Tees Valley.
Conclusion
The macro trend across all CRCs was for fewer re-offenders but those that did were likely to commit more re-offences than previously. This meant that the CRCs recorded a small overall increase in the number of reoffences compared to 2011. Given the difficulties with transforming rehabilitation, the overall results suggest that these probably have not resulted in large increases in reoffending. Local CRC performance can influence results, and that might be why we see wide variation in the number of recorded reoffences compared to the expected number, but these effects were probably small compared to the macro effects. My experience suggests that the police forces are the biggest influence on local reoffending rates and in response to reduced resources many have prioritised high harm and priority offenders – this could explain the macro trends. Any CRC – current or under the future arrangements – should therefore be fully aware of their local police force’s performance and the PCC’s crime plan.


3 Responses
Great resource! For Figure 3, how was the expected number of reoffences calculated? I’ve tried to calculate it myself using published data and am coming up with different figures for both the actual numbers and expected numbers.
Scratch that just getting the expected number mixed up. Would be interested to know how it is calculated.
Hi
The method I used to calculate the expected number of offences was:
[Number of cohort linked to PNC] x [Baseline binary reoffending rate] x [Baseline average number of reoffences]
To calculate the actual number was done by:
[Number of cohort linked to PNC] x [OGRS adjusted reoffending rate] x [Average number of reoffences]
Jack.