Introduction
In order to ensure that the views of service users informed the development of the interactive tool Russell is developing, he designed an online survey and commissioned the Revolving Doors Agency to gain the views of a minimum of 100 individuals who were receiving a service from an agency funded on a PbR basis.
Revolving Doors recruited 10 service users from across the country and tasked each of them with getting 10 of their peers to complete a paper version of the online survey which Russell subsequently uploaded. A total of 103 individuals completed the PbR survey.
The survey
The survey, which was designed to complement a similar survey of frontline staff, asked seven key questions about service users’ experience of PbR with the results set out below. The survey drew on key issues from a PbR literature review including whether service users felt that they received a more individualised service or were treated as a number/target rather than a person. For most questions, respondents were asked if the PbR service they were receiving was better, worse or about the same as other similar (non-PbR) services they had received and were encouraged to provide a comment to expand on their answer.
The survey respondents
Respondents had experience of PbR services in five different sectors:
- Drug and/or alcohol treatment (46 respondents)
- On probation with a Community Rehabilitation Company (35)
- The Work Programme (11)
- Troubled Families (6)
- Homelessness (5)
Just over half (57) respondents were male, 43 were female and one transgender (1 person did not answer this question).
Respondents came from a range of ethnic backgrounds:
- 40 described themselves as white British
- 26 as Black/Black British
- 16 as mixed race
- 13 as Asian/ Asian British
- 5 as “other white”
[3 others preferred not to say]
Respondents were also asked to indicate their age range:
- 1 person was younger than 18
- 47 were aged between 18-24 years old
- 12 were aged 25-30
- 10 were aged 31-40
- 25 were aged 41-50
- 6 were aged 51-60
[2 people didn’t answer this question.]
Respondents were also asked whether they were aware that the service they were using was funded via PbR. The majority (62) were not, just under a quarter did know (25) and the remaining 16 were unsure.
What sort of service did you get?
Exactly 100 people answered this question.
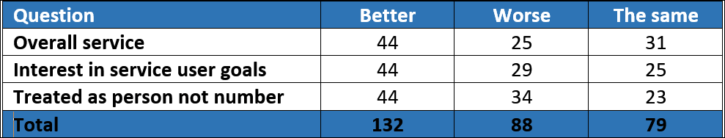
- 44 people said “it provided me with a better service than other similar services I have you”
- 25 people said “it provided me with a worse service than other similar services I have used”
- 31 people said “it provided me with about the same service as other similar services I have used”
54 people provided reasons for their answer; just over half (28) commented on positive aspects of the service they had received, 15 (just under one third) commented on negative aspects with the other 11 comments of a more neutral, factual nature (for instance, I have not used this type of service before.)
How interested was the service in your individual goals?
98 people answered this question.
- 44 people said “it was more interested in my goals than other similar services I have you”
- 29 people said “it was less interested in my goals than other similar services I have used”
- 25 people said “it showed about the same interest in my goals as other similar services I have used”
41 people provided reasons for their answer; just over half (23) made positive comments about how individualised the service were, just under a quarter (10) felt the service was not individualised with the other 8 comments more neutral or factual.
Did the service treat you more as a person or as a number?
101 people answered this question.
- 44 people said “it treated me more like a person than other similar services I have you”
- 34 people said “it treated me more like a number than other similar services I have used”
- 23 people said “it treated me about the same as other similar services I have used”
30 people provided reasons for their answer; just over half (16) made positive comments about the way they were treated, just over a third (11) criticised the way they were treated with the three other comments more neutral or factual.
Please tell us the thing you liked best about this service
92 people answered this question, although only 72 actually cited a positive aspect.
- 38 respondents commented positively on the ability and attitude of their worker(s), saying they felt cared for, supported, treated as a person or not-judged.
- 17 people simply stated that they had got the outcome they wanted – finding work or a home or getting off drugs.
- 9 people identified a specific activity or course that they liked.
- 3 people noted that they had fast access to a service they wanted/needed.
- 3 people stated they liked the structure and motivation they had received.
- 2 people cited the importance of the help and support they got from other service users.
Please tell us the thing you liked least about this service
75 people answered this question, although only 68 cited a negative aspect.
- 28 people commented negatively on the ability and, particularly, the attitude of their worker(s), saying that staff were rude or uncaring or that appointments were inflexible.
- 8 people complained about slow access to services or having to wait regularly for appointments.
- 7 people said simply they did not get the help they wanted – 4 of these citing accommodation specifically.
- 6 people stated that there were not sufficient resources, in particular that they would have liked to attend the service more or for a more extended period of time.
- 5 people complained about poor communication.
- 4 people stated there was nothing they liked about the service.
- 2 people stated they had a long way to travel to the service.
- 2 people did not like other service users.
The other 6 people made specific comments about different aspects of their service.
Please tell us the one thing that would most improve this service
76 people answered this question with 71 identifying an issue for improvement. For most people their answer was linked to the thing they liked most or least about the service they were receiving.
- 22 people would have liked the quality/attitude of staff to be improved.
- 17 wanted more resources for a greater range or more intensity of services.
- 6 people wanted more access to housing.
- 5 wanted a fairer, more flexible service.
- 3 people wanted the service to be totally overhauled.
- 3 wanted a more co-ordinated service with the same worker.
- 2 people wanted better communication and
- 14 people identified a range of other specific issues which could be improved.
Analysis
In analysing these results, it is important to state that this is a small survey which looked at the experience of service users across a range of different sectors.
Nonetheless, there are some interesting points to be made.
Service users were more likely to be positive about the PbR service they received than negative. The main findings are summarised in the table below:
Interestingly, irrespective of the type of service or whether people felt positively or negatively about it, the most important elements tended to be the quality and attitude of staff, a flexible and personal approach, sufficient resources and access to housing.
One service user eloquently summed up his feelings in 11 words:
What do you most like about this service?
My worker, John
What do you least like about this service?
My old worker, Angie
Please tell us one thing that would most improve this service?
More Johns, less Angies
Special thanks to Paula Harriott, the service user involvement manager at Revolving Doors Agency, and the service users researchers who gathered the views of their peers.