
Justice in Numbers pocketbook
This post looks at a reasonably recent attempt by the Ministry of Justice to make justice data more easily accessible. The Justice in Numbers pocketbook has been published and updated every month since October 2022. The last edition was published on 10 July.
The pocketbook contains a wide range of statistical information in the 72-page pocketbook itself and three pages of headline measures in a stand-alone three page document.
Contents
The pocketbook seeks to be pretty comprehensive with summary tables covering headline measures, public protection (that’s prison stats to you and me), reducing reoffending and access to justice before detailed figures covering everything from recorded crime through prison population and probation caseload on to reoffending rates, court backlogs, prison releases, numbers released on ROTL to cover just some of the contents.
Much of the information is presented clearly with helpful graphs showing the trends over recent years (often the most important contextual information for any dataset). It also tells you the source of each dataset when it was last published, the date of the next release and (wahay, MoJ digital strikes again) a QR code which you can scan to take you direct to the page on the justice website. The QR codes work, even when scanning off a monitor screen.
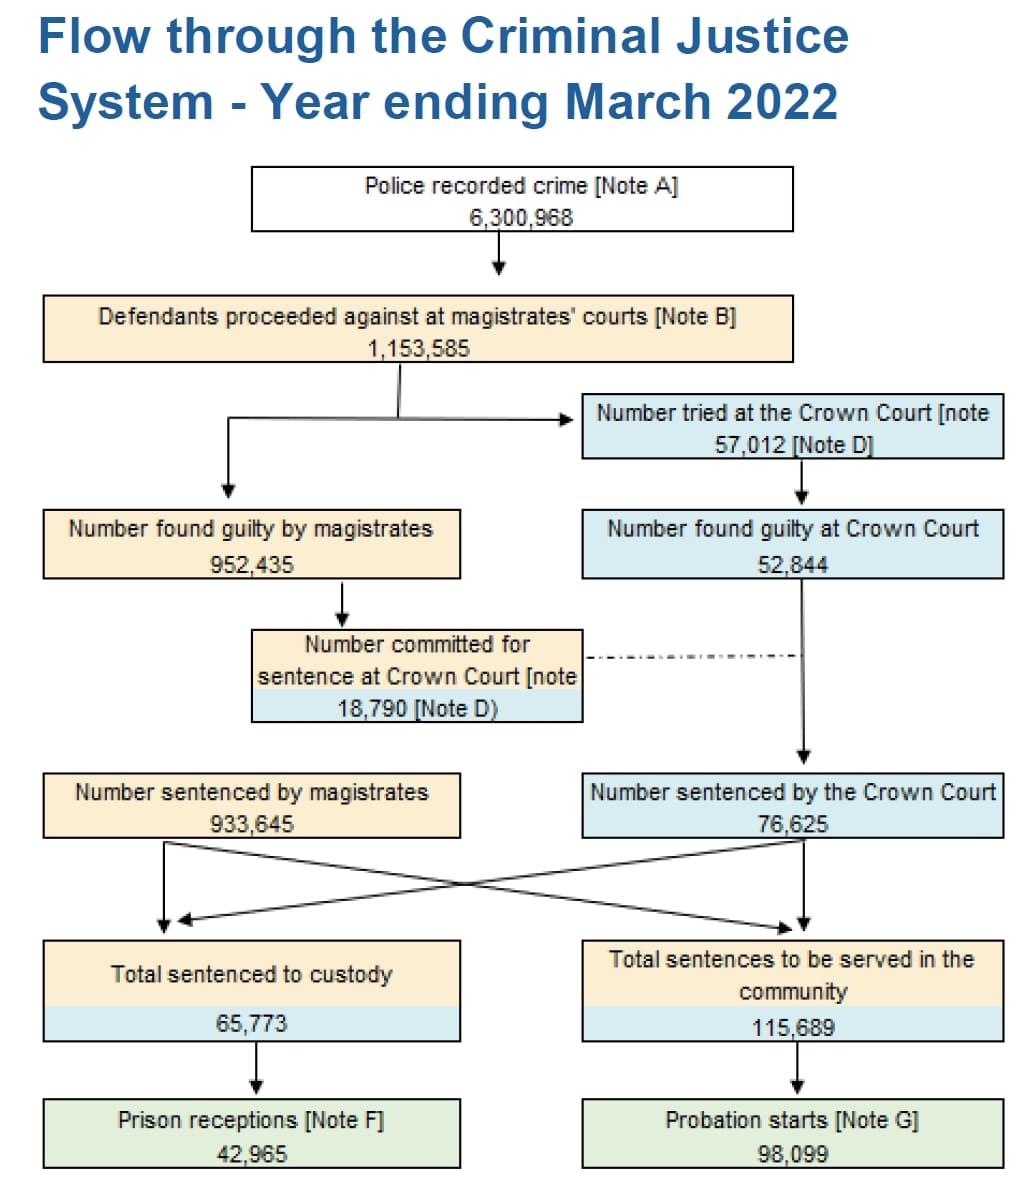
The document is well worth a perusing and probably worth the investment of time for the flow through the criminal justice system infographic reproduced further down this blog post.
Prison stats
The prison – sorry “Public Protection” – section is likely to be invaluable for criminologist, policy wonks, penal and campaigners and all interested others. It includes the following, reasonably comprehensive list of topics:
- First receptions
- Population (including by sex, age and offence)
- Prison releases
- ROTL
- The number of male, female and children’s establishments
- The public/private sector split (107 public, 15 private with the latter number due to rise with the number of new establishments being built)
- Operational capacity
- Staffing levels
- Overcrowding levels
- Assaults
- Self-harm
- Self-inflicted deaths
- Random mandatory drug testing (traditional drugs)
- Barricades
- Risk management audit
- Escapes
- Absconds
- Security Audit
- Electronic monitoring caseload
Pretty comprehensive as I said.
My one quibble is that everything is up-to-date with the exception of the prison population. This is a little odd for a monthly publication in which everything else is as up to date as the different publication frequency of the varying datasets allows.
The prison population for the 10 July publication is given as the figure for 31st March although these figures are published on a weekly basis, every Friday. The March figure was 84,372 while the figure for 7 July was 86,035 showing clearly the rapid acceleration in the number of people we incarcerate during the current calendar year.
I hope you’ll feel that this minor quibble doesn’t spoil an excellent initiative in transparency. Next time you are sure someone has got their criminal justice facts and figures wrong, just reach for your Justice in Numbers pocketbook and win the argument.
