Re-offending rates
Last week the MoJ published the latest data on re-offending rates.
These figures will be scrutinised more closely than ever given the upcoming privatisation of the probation service via the government’s Transforming Rehabilitation project.
Proponents and critics of TR will seek to find ammunition for their cause.
And those seeking to win the new reoffending contracts will be delving into the small print.
I’ve done some very basic analysis to try to identify key trends.
Are re-offending rates going up or down?
The MoJ report provides tables for one year re-offending rates for the period 2005-2011 (ending in September of each of those seven years).
The first thing I did was look at “adult proven re-offending data by probation trust on first commencement” – which is the baseline to see how effective probation trusts are at reducing the reoffending of those they supervise.
The overall re-offending rate over the seven year period shows a slight downward trend that looks as if it may be bottoming out.

What’s the difference between Probation Trusts?
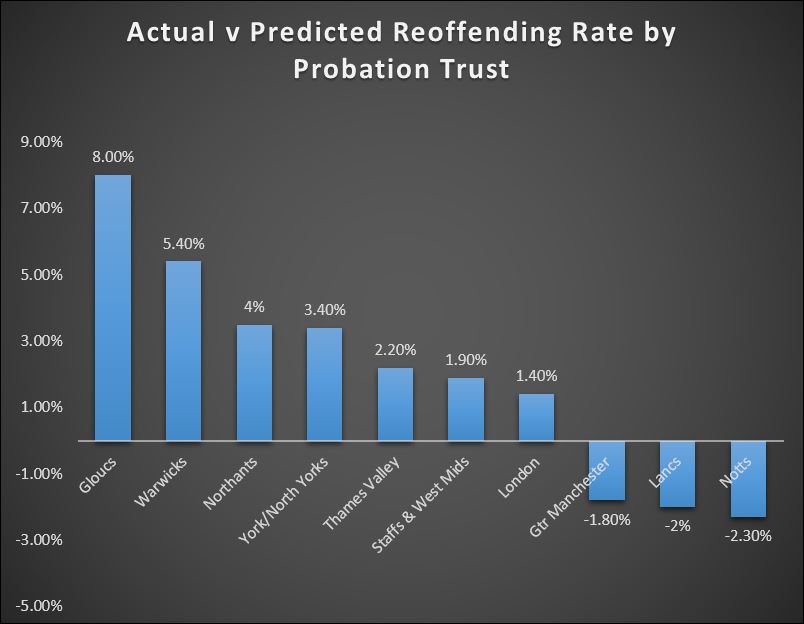
What, to me, was much more interesting was to examine the difference in re-offending rates between probation trusts.
I thought the fairest thing to do was to compare the predicted rate of re-offending with the actual one.
The predicted rate takes into consideration the profile of offenders in a local trust area. In other words, it ensures that a probation trust with a high number of prolific offenders is compared equally with another trust which supervises a cohort of offenders less likely to re-offend.
Performance varied, although mainly within quite a narrow band.
Seven probation trusts showed significantly lower proven re-offending rates than expected.
These were Gloucestershire, London, Northamptonshire, Staffordshire and West Midlands, Thames Valley, Warwickshire and York and North Yorkshire.
Three (Greater Manchester, Lancashire and Nottinghamshire) showed significantly higher proven re-offending rates than expected.
When the MoJ has revised its Straw Man payment mechanism (publication expected imminently), we may get a clearer picture of what will happen to top and bottom performing Contract Package Areas when new service providers start operating in 2015.