For the seventh year in a row, the number of people estimated to be sleeping rough in England has increased. New figures from the Ministry of Housing, Communities & Local Government have revealed a 15 percent jump from 2016 to 2017.
The DHCLG statistics provides information on a single night snapshot of rough sleeping that is taken annually in England using street counts and intelligence driven estimates. Local authorities’ counts and estimates show that 4,751 people slept rough in England on the one night in autumn 2017. This is up 617 (15%) from the autumn 2016 total of 4,134.London
Of these, there were 1,137 rough sleepers in London. This is an increase of 18% from the 2016 figure of 964. In 2017 London accounted for 24% of the total England figure, compared to 23% in 2016 and 26% in 2015. Within London, there are rough sleeping communities that move around boroughs. This leads to larger across borough movements in numbers than the change across London as a whole. Across the 33 boroughs of London 19 or 58% of local authorities reported increases, 11 or 33% reported decreases and 3 or 9% reported no change in the number of rough sleepers since 2016. Camden reported the largest increase from 17 in 2016 to 127 this year. Westminster showed the greatest decrease of 43, or 17% from last year.The rest of England
There were 3,614 rough sleepers in the rest of England, an increase of 444 or 14% from the 2016 figure of 3,170. 213 or 48% of this increase was due to increases reported by 8 local authorities Brighton and Hove, Medway, Southend-on-Sea, Oxford, Tameside, Worthing, Salford and Eastbourne. As you can see from the Statista infographic below, the number of rough sleepers has increased every year since 2010.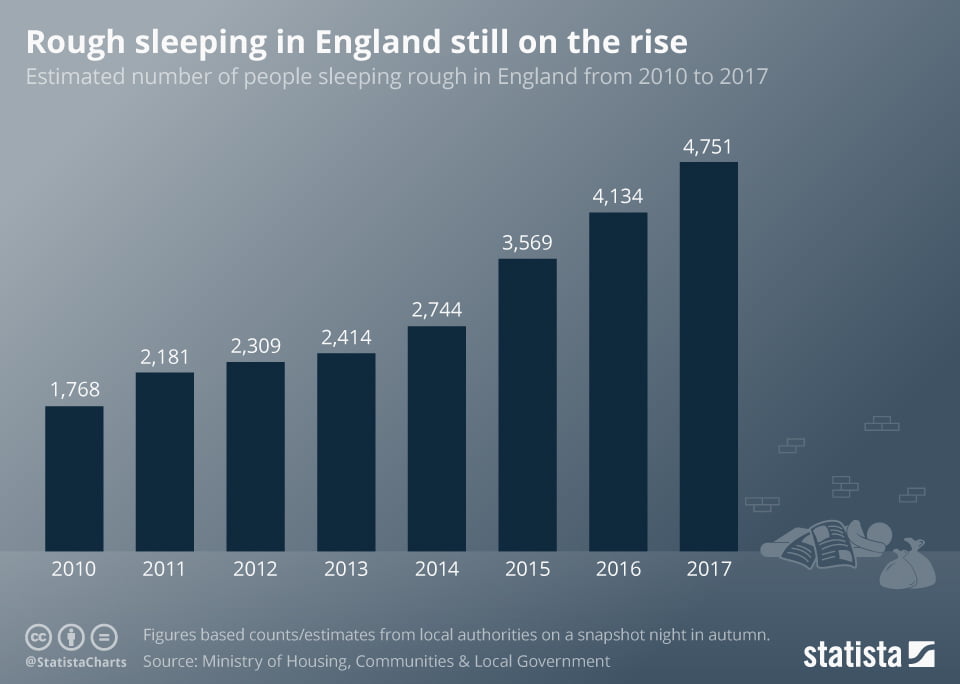
Conclusion
Chief executive of Shelter Polly Neate made the point that homelessness affects many more people than those unfortunate enough to try to survive on the streets:
These figures expose the worst pain inflicted by our housing crisis. We have failed as a society when so many people are forced to sleep rough. But they are not alone, the scourge of homelessness extends far beyond our streets. Hidden away in emergency B&B’s, temporary bedsits and on friend’s sofas are hundreds of thousands of other homeless people, including families with children.
Most of these people are homeless simply because they couldn’t afford to live anywhere, a situation made worse by welfare cuts. While the intentions of the Homelessness Reduction Act are good, it cannot fix this crisis. To do that, the government must act to build a new generation of genuinely affordable homes to rent, as well as ensuring housing benefit is fit for purpose in the short-term.


One Response
Where is ‘Dame’ Louise Casey when we need her? In her heyday, she could ‘spin’ these figures down to zero in the blink of an eye.