Race and the criminal justice system
The latest statistics on race and the criminal justice system – covering 2014 – were published at the end of last month (26 November 2015) by the Ministry of Justice under Section 95 of the Criminal Justice Act 1991.
The publication compiles statistics from data sources across the Criminal Justice System (CJS), to provide a combined perspective on the typical experiences of different ethnic groups.
The MoJ is keen to argue that no causative links can be drawn from these summary statistics, and notes that no controls have been applied to account for differences in circumstances between groups (e.g. average income or age).
The MoJ does admit that the racial differences observed at almost every stage of the criminal justice system:
may indicate areas worth further investigation
but contends that they should not be taken as evidence of bias or as direct effects of ethnicity.
In general, Black, Asian and Minority Ethnic (BAME) groups are over-represented at most stages throughout the CJS, compared with the White ethnic group.
Among BAME groups, Black and Mixed individuals are often the most over-represented. The MoJ observes that trends over time for each ethnic group have tended to mirror overall trends, with little change in relative positions between ethnic groups.
[divider]
No evidence of progress
This lack of change is the thing that gives me most concern.
Given that the Macpherson report into the murder of Stephen Lawrence was published in 1999 and found that the Metropolitan Police were institutionally racist, why have things not improved over the last 15 years?
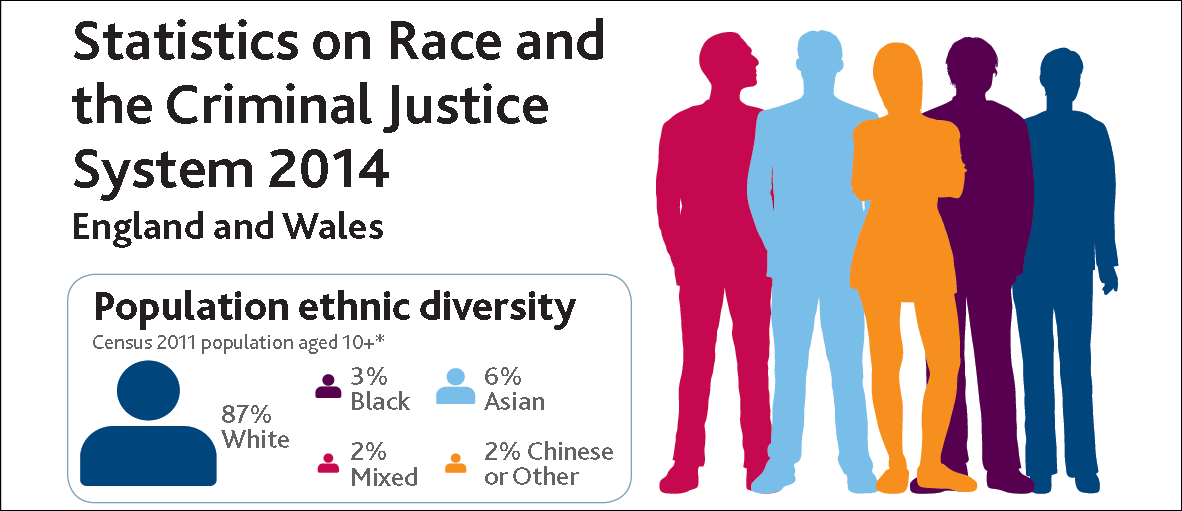
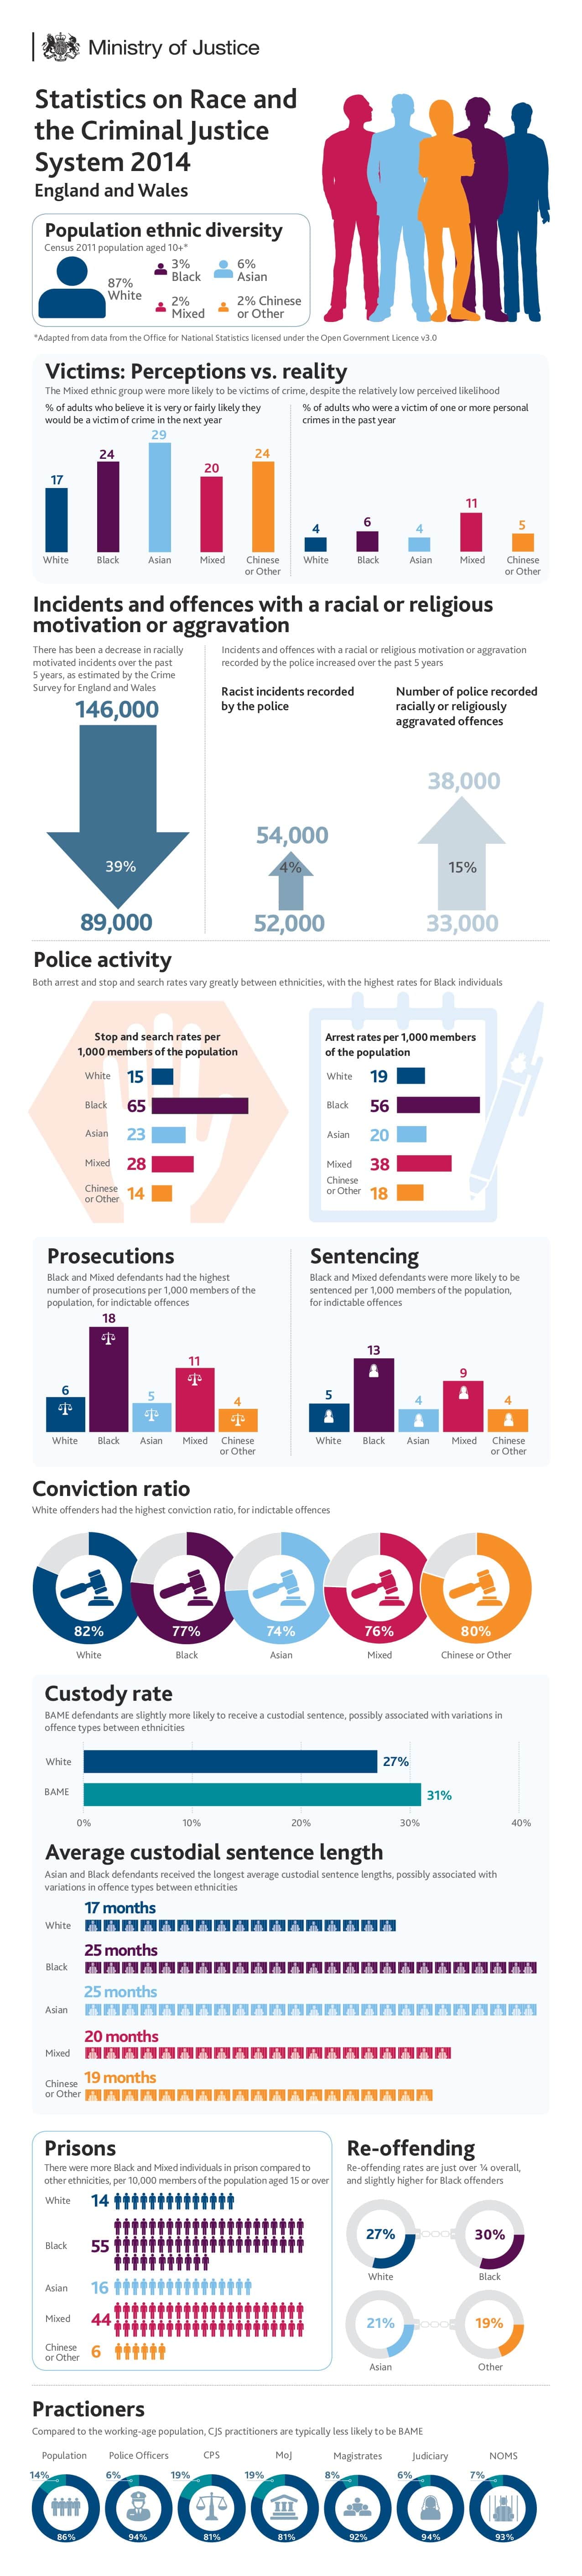
Below is the accompanying infographic published by the MoJ to summarise its main findings.
As you can see there are proportionally four times as many Black and three times as many Mixed people in prison compared to their white counterparts.
The proportion of Black people in the police, probation and prison services, as well as the magistracy and judiciary is much smaller than the proportion of Black people in the working age population.


2 Responses
Hi, I would love to get hold of a clearer version of the infographic to show my A level sociology students…any chance you could link me up with a version which will print onto A4 legibly?
Hi Marianne
Here’s the original (it’s too long to print legibly on one page of A4): https://www.gov.uk/government/uploads/system/uploads/attachment_data/file/479990/infographic.pdf
Best Wishes
Russell