
Crime figures for the year to June 2017
Last week’s (19 October 2017) crime figures which cover the year ending June 2017 make for interesting reading with a clear indication that the rise in crime they portray is not merely the result of better police recording practices.
Of particular concern, is the confirmed trend in the rise of the number of homicides — there were 629 people killed last year (excluding the victims of the terrorist attacks in Manchester and London) compared to 583 the year before (when the manslaughter of the 96 Liverpool fans at Hillsborough in 1989 are removed from the figures): an 8% increase.
Main findings
John Flatley, the ONS statistician responsible for these figures (@ONSJohnFlatley on Twitter) makes seven key points about the latest figures:
- Official statistics cannot provide a measure of all crime, but the available sources can provide useful insights to long-term and emerging trends in crimes.
- The Crime Survey for England and Wales (CSEW) provides a good measure of long-term trends for a selected range of crimes experienced by the general public, including those not reported to the police and the latest figures show one in five adults, aged 16 and over, had fallen victim in the previous year.
- Including new Experimental Statistics on fraud and computer misuse offences, the CSEW estimated 10.8 million incidents of crime in the latest survey year, but first annual comparisons will not be available until January 2018.
- The police recorded 5.2 million offences in the latest year; this series can provide a better indication of emerging trends but can also reflect changes in recording practices and police activity rather than genuine changes in crime.
- The 13% increase in police recorded crime from the previous year reflects a range of factors including continuing improvements to crime recording and genuine increases in some crime categories, especially in those that are well-recorded.
- The new presentation of official statistics on violent crime highlights there were 711 deaths or serious injuries caused by illegal driving, a 6% rise from that recorded in the previous year.
- A number of sources showed a rise in bank and credit card fraud in the last year; UK Finance reported a 3% rise in the volume of fraudulent transactions reported on UK-issued cards.
Crimes against children
The latest Crime Survey for England and Wales (CSEW) estimated that around 11 in 100 children aged 10 to 15 were victims of at least one crime in the latest survey year ending June 2017. A total of 733,000 crimes were estimated to have been experienced by children aged 10 to 15:
- 49% were violent crimes (359,000), with the majority of these being low-level violence
- 37% were thefts of personal property (271,000)
- 7% were criminal damage to personal property (52,000)
- 7% were robbery (50,000)
Violent crime
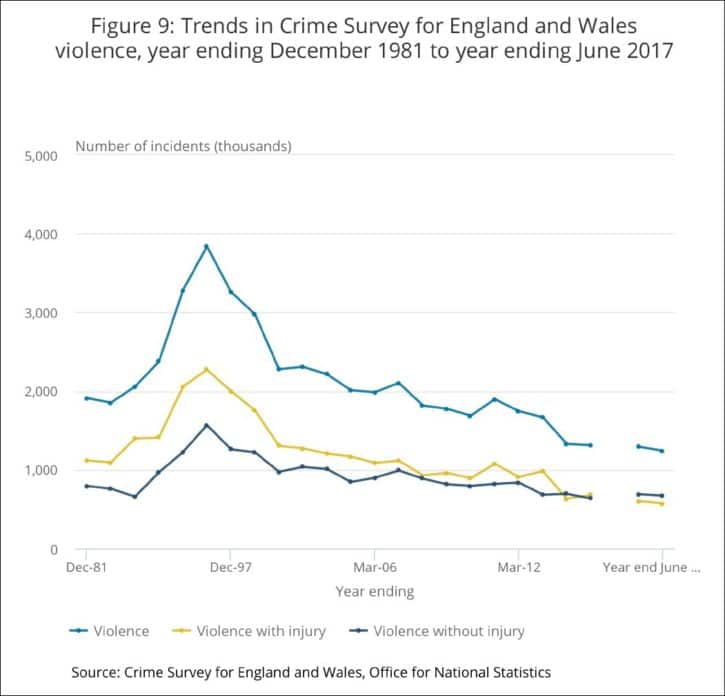
As the ONS points out, the picture on violent crime is complex.
CSEW (which interviews large numbers of the public for their experience of crime as victims and seen as a better indicator of trends) estimated there were 1.2 million violent incidents experienced by adults aged 16+ in the year to June 2017, a 4% drop on the previous year although this is not regarded as statistically significant.
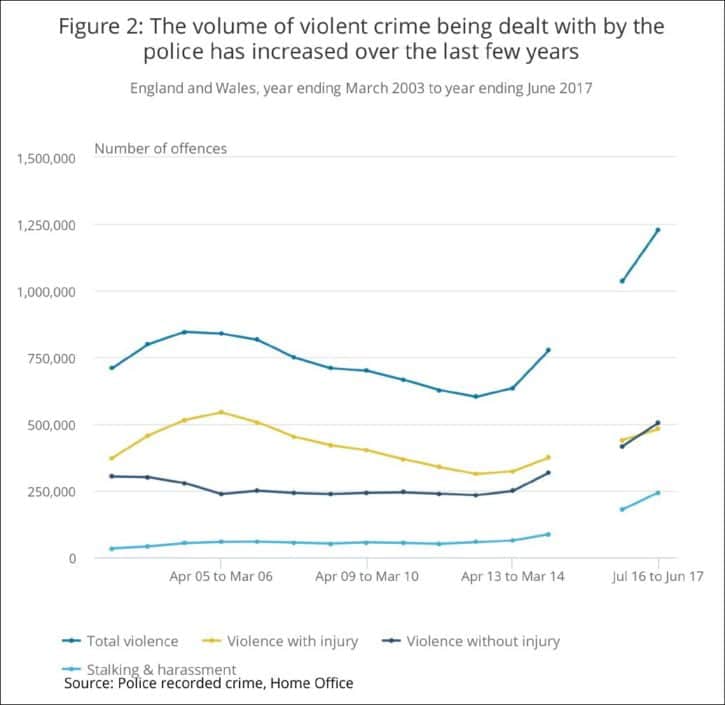
By contrast, police records of violent crime show a big increase. Much of this is thought to be attributable to ongoing work by police forces over the last two-to-three years to improve crime recording practices which obviously make interpreting trends in police recorded violence against the person offences difficult.
These changes in recording practice are thought to have had a larger effect on relatively less-serious types of violent crime but to have had a lesser impact on more serious offences such as homicides and the use of weapons.
Overall crime figures
The latest CSEW estimate is 5.8 million incidents of crime in the year ending June 2017, a 9% reduction compared with the previous year. However, these headline estimates do not yet include fraud and computer misuse offences as these have not been included in the survey for the full two years needed to make annual comparisons. Including fraud and computer misuse, there were an estimated 10.8 million incidents of crime in the year ending June 2017.
Blog posts in the Criminal Justice category are kindly sponsored by Get the Data which provides Social Impact Analytics to enable organisations to demonstrate their impact on society. GtD has no editorial influence on the contents of this site.