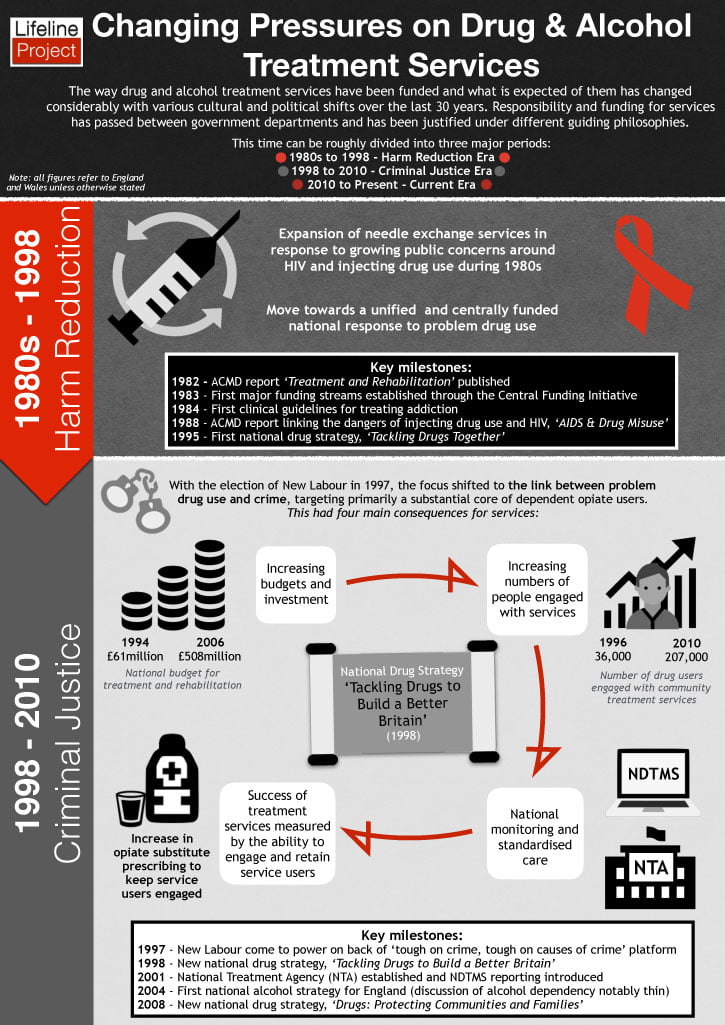
Lifeline recently (February 2017) published an excellent infographic crammed with information on the way drug and alcohol treatment services have been funded over the last 30 years.
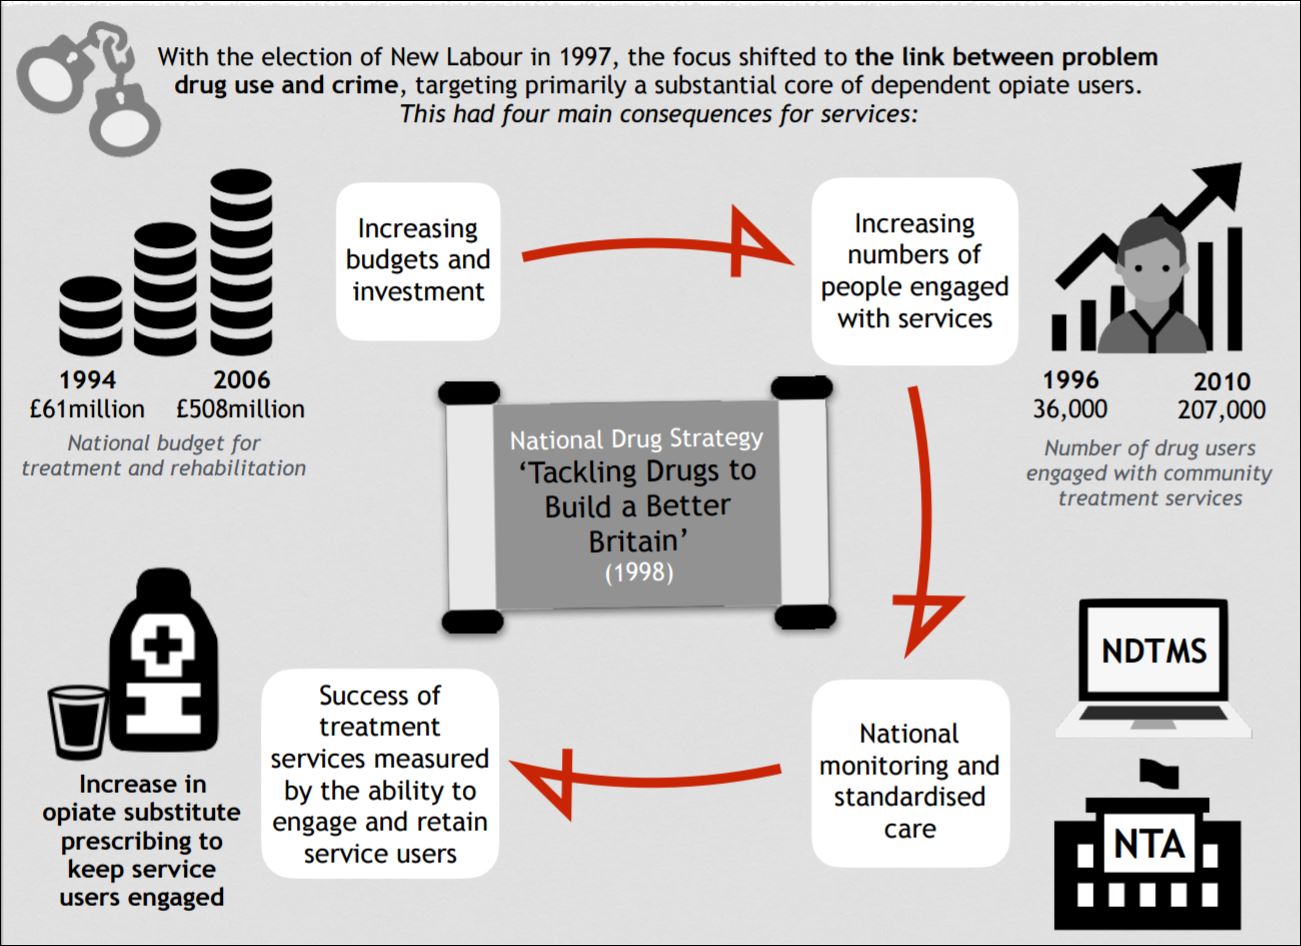
It contains information on how the various cultural and political shifts over that time have altered the expectations on these services.
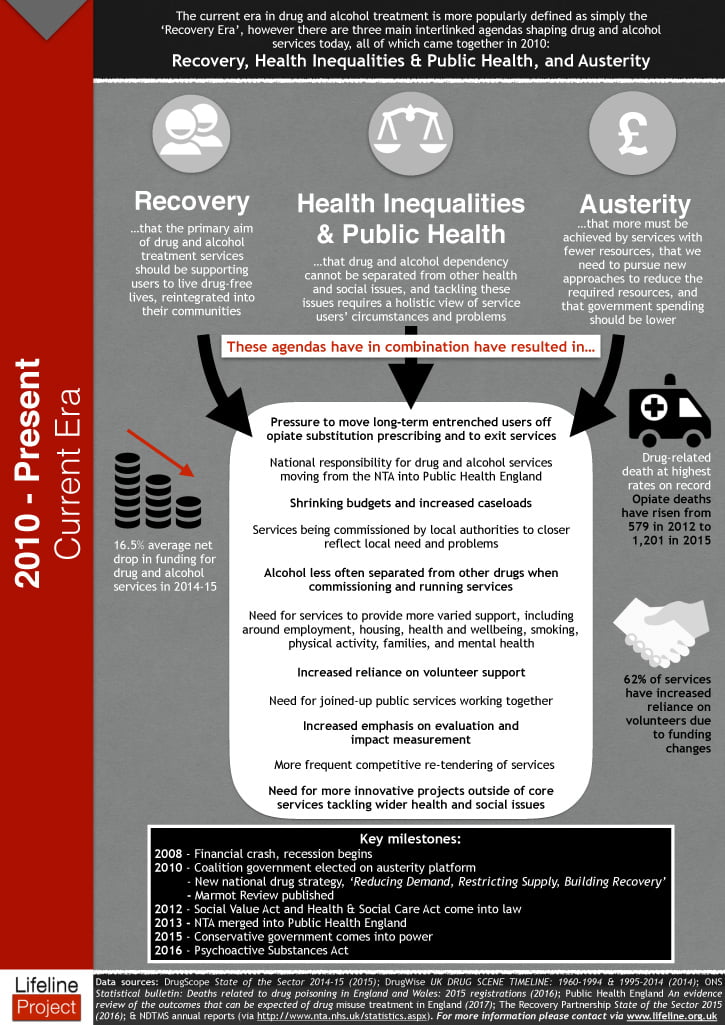
You can find the original here but I have replicated the two pager in the images below:


One Response
Great graphic, I was lucky enough to work for the NTA in the heady days of harm-minimisation orientated treatment and the one below shows why I left. Awful to see that drug related deaths are increasing. But it is missing anything on acquisitive crime, which is commonly drug related also. My suspicion is that that is also increasing, hence Scottish police advocating heroin on prescription?